User Guide

User Guide |

|
Mac: Open the .dmg file and drag Prodar.app into the Applications folder. Launch in the usual way.
Windows: Unzip the .zip file and execute Prodar.exe located in the "Win32" folder. You may also need to install vcredist_x86.exe if this is not already on your system -- it is the Microsoft Runtime Libraries. This is available from Microsoft here.

The message at the bottom says that the built-in PDB database is loaded and ready for searching. To start searching, a PDB file needs to be opened. Choose
File -> Open PDB Structure
to open the PDB file of interest.
Once a PDB file is opened, click "Search" to search on the whole structure with the default settings.

In this example the query (1U53-A) is quite a long sequence, and multiple distinct regions of the query backbone have been identified to align with entries in the PDB. These are indicated in red on both the histogram and on the 3d illustration of the backbone.
Each search result shows graphically the location of the matched region (red) by overlaying the query sequence (white) with the retrieved PDB structure from the database (blue).
Notice in the screenshot above that all of the alignments visible on the screen correspond to a section of backbone near the start of the query structure. This will be the left-most peak that can be seen in the histogram.
It is clear from the histogram that the search has discovered three sections of the query structure that tend to match many other entries in the PDB. If you look carefully there is actually a fourth (although very small). It is possible to refine the search to just one of the identified regions by specifying a search range. For example, if we select the middle peak with the mouse, on the right-hand side of the graph the selected region is shown numerically. In this case it is the range 45-75.

We can enter that range into the search field

and perform the search again.
(It is possible to specify multiple search ranges separated by commas in the same way that page ranges are typically specified when printing a document.)
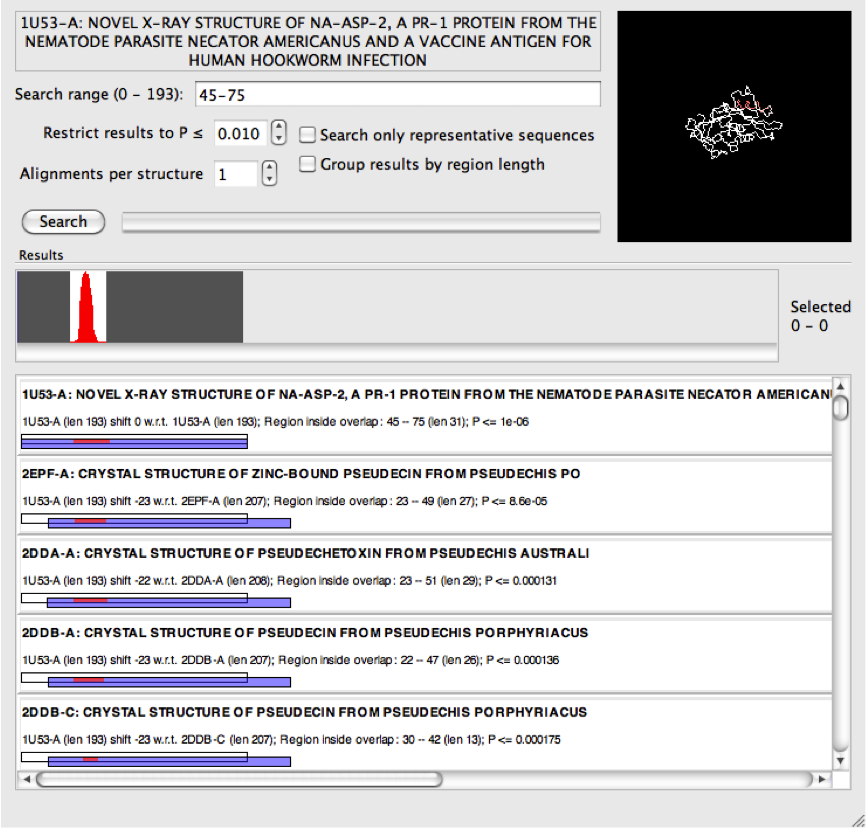
The results from the narrower search above now indicate many matches that have obviously high sequence identity. So while as a group these may be interesting, it is not necessary to clutter the search results with all of them. For this reason it is possible to select "search only representative sequences". Only those sequences in the PDB that belong to PISCES representative set [1] are included in the search, and this will also have the effect of increasing the search speed!
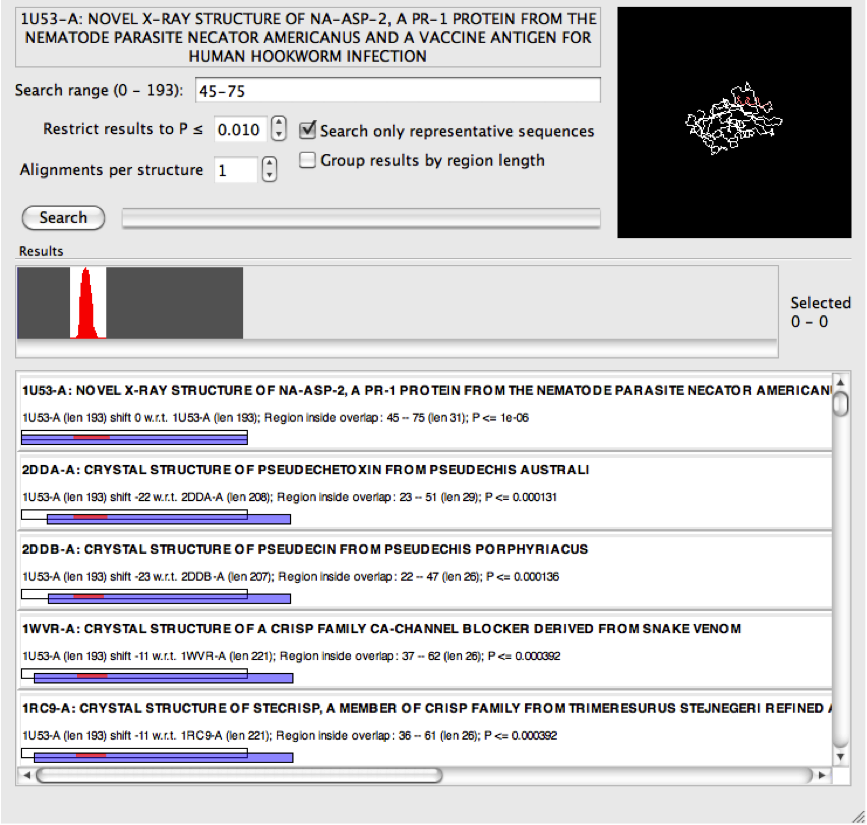
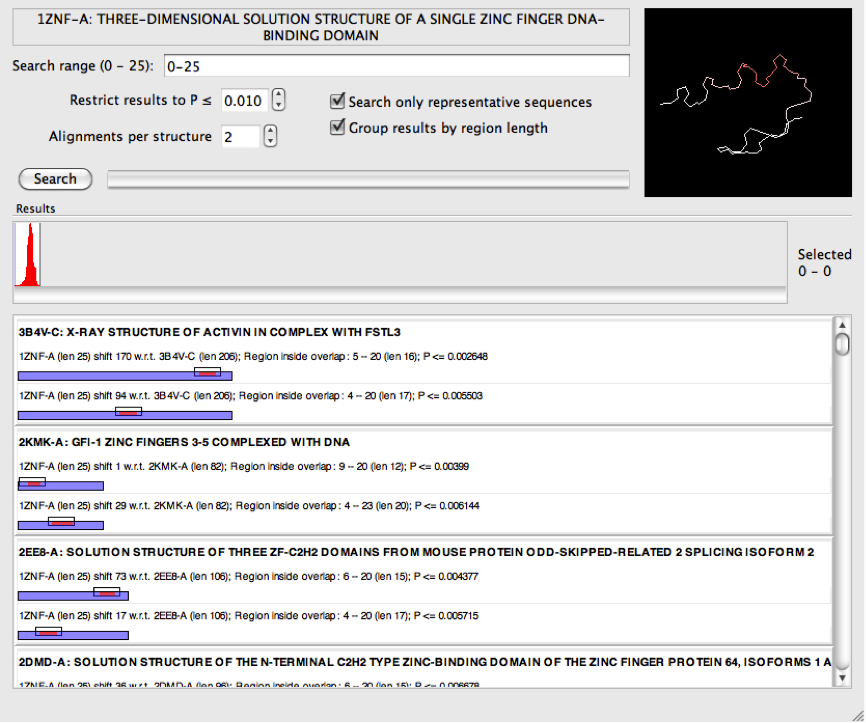
When performing searches using smaller queries, the "top" results can be too short to be of interest (perhaps just a couple of residues, but of course this depends what you are looking for). For example, the zinc finger search below has many such results:
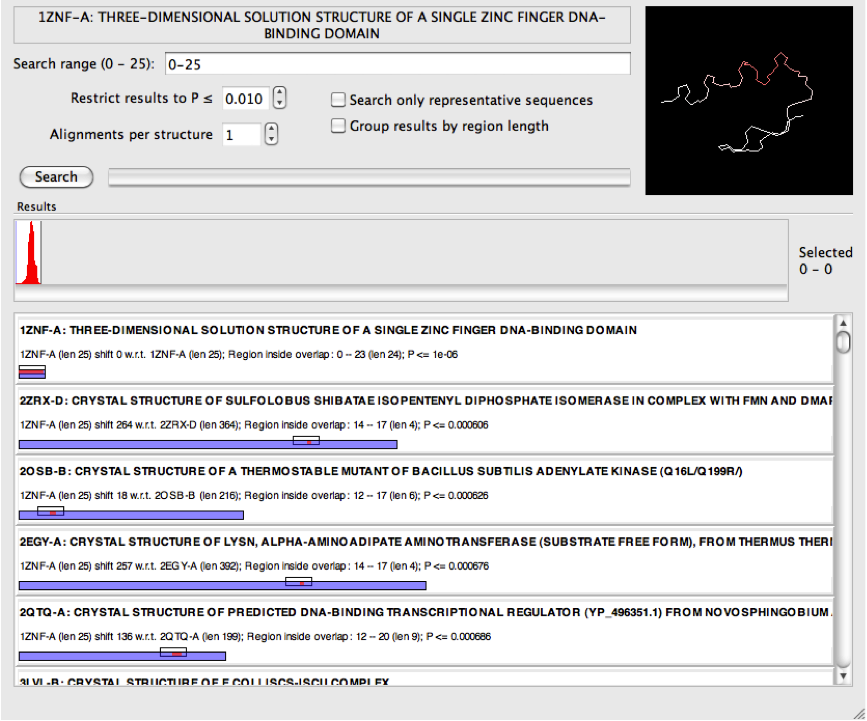
In these situations it may be helpful to select "Group results by region length". This will order the results differently following a search such that the longest are shown at the top rather than those with the smallest P-value. Because P-values are not being used to sort the results, consider adjusting the maximum tolerated P-value (this setting is immediately underneath the search range) when using this setting to find results of an appropriate length. If the P-value is too low, the returned results may be too short to be meaningful, but if set too high it invites false positives.
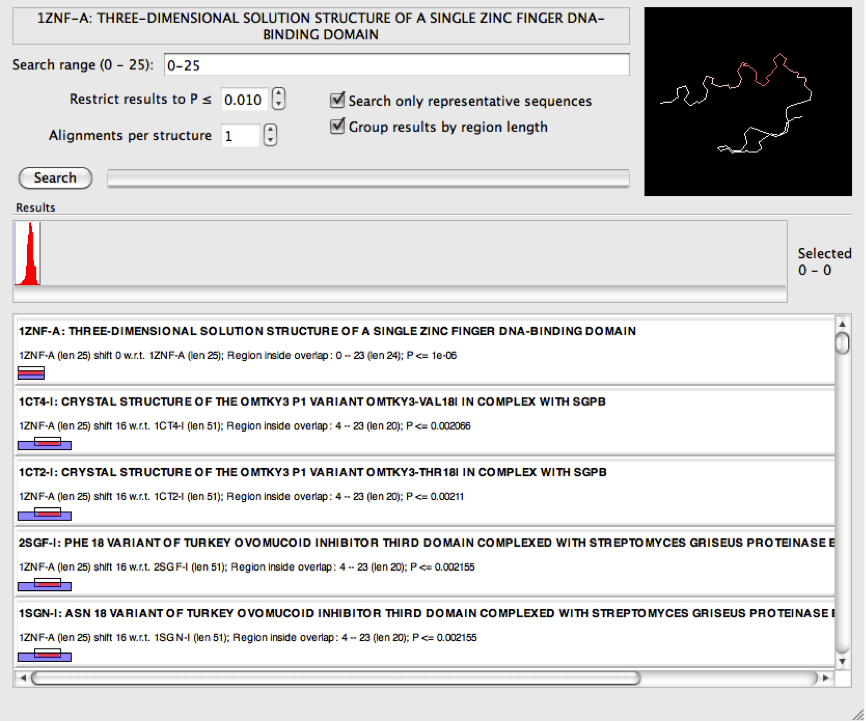
It can also be helpful for short sequences to increase the number of alignments per structure. For example, increasing this to 2 for the zinc finger example above lead to some structures in the PDB being identified which appear to have multiple zinc finger domains.
The figure below illustrates how each result should be interpreted. The "overlap" is the area where both the query (white) and matched pdb structure (blue) overlap. All units are in amino acid residues.

It is the red part of the match that is the statistically significant region of interest, and this is expressed in terms of its distance from the point where the two structures overlap. All matches are actually relationships between consecutive pairs of residues in the sequences - so for a matched region of length 1, this is actually the relationship between the identified residue and its next neighbour (to the right). This is why when a structure matches itself, the matched region is the length of the sequence minus 1.
The quoted P-value is the probability that a matching region of the same length with the same or better alignment score would have occurred had the query been randomly selected from the PDB. The P-values have been calculated empirically using Monte Carlo sampling.
| [1] | "pdbaa: Sequence Files Representing the Whole PDB", downloaded Feb 20 2011. G. Wang and R. L. Dunbrack, Jr. PISCES: a protein sequence culling server. Bioinformatics, 19:1589-1591, 2003. |